 Jun 17, 2026
 Table of Contents
Maintaining high system availability is an ongoing operational challenge. When a critical production system fails, the financial clock immediately starts ticking against company revenue and customer trust. Traditional on-call workflows often struggle under this pressure, which is why engineering leaders are adopting AI incident triage and root cause analysis to stabilize their infrastructure and protect their software delivery pipelines.
Key Takeaways
- Noise Reduction: Intelligent automation compresses thousands of disjointed alerts into a single, cohesive incident timeline, eliminating alert fatigue.
- Faster Recovery: By automatically connecting system metrics, logs, and traces, platforms can locate the origin of an infrastructure failure in seconds rather than hours.
- Risk-Managed Control: A successful deployment balances automated data collection with human verification checkpoints to keep production environments safe.
Why Is Traditional Incident Triage Failing?
Traditional incident triage fails because modern distributed cloud architectures generate an overwhelming volume of data, making it impossible for human responders to manually isolate root causes quickly during a critical outage.
How Modern Microservices Create Toxic Alert Fatigue
Microservices create alert fatigue because one technical issue can trigger alerts across many dependent services.
A database slowdown may cause API timeouts. API timeouts may affect downstream services. Downstream failures may trigger retry storms, queue delays, and more error alerts.
As a result, engineers receive a wall of notifications from different monitoring tools. Many alerts are accurate, but not all are useful. Some point to symptoms, not the original problem.
This creates three problems:
- Critical anomalies get buried under duplicate alerts.
- Engineers waste time checking secondary failures.
- Response time increases because the signal-to-noise ratio is poor.
Alert fatigue is not only annoying. It directly affects Mean Time to Resolution because responders need more time to find the first meaningful signal.
The Hidden Cost of “Tool Hopping” During Outages
Responders waste critical minutes shifting between independent dashboards, version histories, and communications channels during live downtime.
During an active system outage, every second spent hunting for information extends your Mean Time to Resolution (MTTR). In a traditional operations setup, engineers must manually log into cloud infrastructure consoles to check server health, open log aggregation platforms to read error traces, and review version control histories to see what code went live recently. Piecing together a coherent timeline from these disconnected software applications manually introduces massive operational friction, delays coordination, and increases the financial impact of system downtime.
Why Static Runbooks Fail When Cascade Failures Occur
Fixed, rule-based parameters collapse when multi-layered cloud dependencies trigger unpredictable, overlapping system errors.
Static operational documentation and rigid, threshold-based alerts assume that infrastructure failures happen in predictable, linear patterns. However, modern cloud environments are highly dynamic and constantly changing. When an unexpected combination of auto-scaling delays, network latency, and database connection pools failing occurs all at once, the resulting cascade failure will bypass traditional threshold checks entirely. Static documentation quickly becomes outdated as the underlying software architecture evolves, leaving on-call teams without an accurate guide when complex, multi-layered incidents strike.
How Does AI Automate Triage? Root Cause Analysis
AI automates incident response by instantly ingesting system logs, metrics, and traces, filtering out background noise, and mapping dependencies backward to find the exact source of a failure.
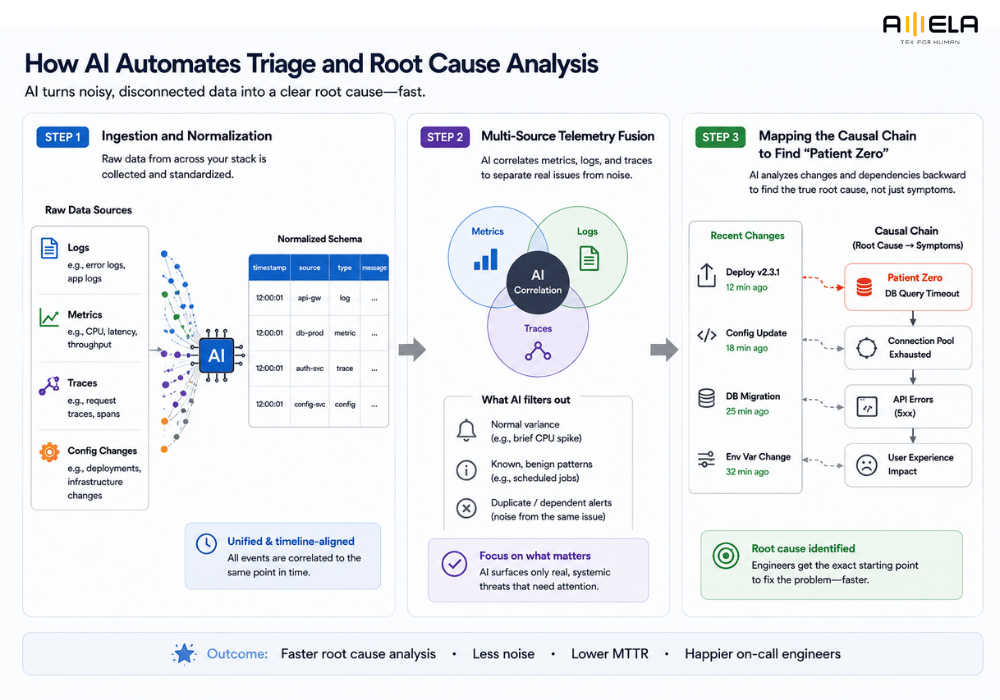
Step 1: Ingestion and Normalization
AI pipelines aggregate raw infrastructure events and convert them into a uniform data schema for clean processing.
The automation process begins by establishing continuous data feeds from every corner of your operational stack. The system securely collects unstructured text logs, timeseries performance metrics, system traces, and application configuration updates. Because these records arrive in completely different formats depending on the cloud provider or service used, the underlying models normalize the incoming streams into a standardized metadata schema. This transformation ensures that all operational activities are accurately aligned to an exact, synchronized timeline.
Step 2: Multi-Source Telemetry Fusion
By cross-referencing system metrics, logs, and traces simultaneously, AI isolates true performance deviations from routine spikes.
Rather than assessing individual alerts in a vacuum, advanced analytical models use multi-signal correlation to evaluate the entire environment at once. For instance, if an application server reports a sudden spike in response latency, the system immediately correlates that metric with concurrent error spikes in your application logs and anomalous trace paths in your API gateways. This automated cross-referencing filters out normal operational variance, allowing the system to dismiss minor background alerts and prioritize real, systemic infrastructure threats.
Step 3: Mapping the Causal Chain to Find “Patient Zero”
Specialized algorithms analyze recent deployments, code commits, and database states backward to separate a root cause from its downstream symptoms.
Once a legitimate incident is identified, the system acts as a digital investigator by mapping dependencies backward from the point of failure. Instead of simply reporting that a service has crashed, specialized AI agents for DevOps evaluate server execution states, changes to environmental variables, and recent software deployments to pinpoint the actual catalyst. By tracing this causal chain automatically, the platform isolates the original failure point—such as a specific misconfigured database query—from the hundreds of downstream application errors it caused, giving your engineering team the exact data needed for an immediate fix.
What AI Tools Are The Best for Incident Management?
The best AI tools for incident management categorize into observability-centric platforms for deep system metrics and incident-native platforms that focus on team orchestration and event compression.
Observability-Native Platforms vs. Incident-Native Systems
Choosing between an observability platform or an incident orchestration system depends on whether your team needs deep telemetry diagnostics or automated event deduplication.
Observability-native systems, such as Dynatrace or Datadog, focus on gathering deep performance data directly from your application infrastructure. They excel at monitoring distributed traces, raw log files, and core computing metrics to flag performance drops as they happen. On the other hand, incident-native tools like BigPanda, Incident.io, or Rootly step in after an anomaly is flagged. These platforms prioritize alert routing, noise reduction, and workspace organization, helping operations teams collaborate seamlessly without drowning in overlapping Slack messages or on-call pages during an outage.
Top Tools to Consider
Engineering leaders should assess AIOps solutions by looking closely at data retention, setup overhead, and operational risk guardrails.
Traditional APM and SIEM Alerting
- Core Metrics Tracked: Focuses primarily on isolated server metrics, CPU usage, and raw infrastructure logs.
- Triage Accuracy: Low; routinely generates high volumes of duplicate, unlinked alerts that fuel on-call fatigue.
- Setup & Configuration Overhead: High; demands continuous manual rule creation and constant threshold tuning.
- Risk & Operational Guardrails: High safety margin; relies entirely on read-only alerts with zero autonomous action capabilities.
Modern AI SRE Platforms
- Core Metrics Tracked: Tracks distributed system traces, application log patterns, and deployment history.
- Triage Accuracy: High; groups and compresses scattered alerts into unified, chronological incident timelines.
- Setup & Configuration Overhead: Medium; relies heavily on pre-built API integrations and historical baseline data to map environments.
- Risk & Operational Guardrails: Moderate; configuration checks are automated but rarely execute direct environment fixes without team intervention.
Hybrid Operational Models
- Core Metrics Tracked: Tracks comprehensive cross-cloud infrastructure health, real-time security logs, and database indexing.
- Triage Accuracy: Exceptionally high; merges multi-agent automated event compression with professional human analysis.
- Setup & Configuration Overhead: Low; fully deployed and managed by an external software delivery team using your existing logging pipelines.
- Risk & Operational Guardrails: Maximum protection; all automated tracking and diagnostics are strictly gated by human engineering verification before execution.
Balancing Automation With Control: The AMELA x CloudThinker Hybrid Model
A collaborative operations structure pairs advanced automated alert compression with real-world human verification to protect system runtime stability.
For growing businesses, deploying an entirely unguided AI tool directly into a live system introduces significant operational risk. To solve this, we provide a balanced approach that combines automated efficiency with human judgment. In this hybrid model, a coordinated layer of 135+ automated AI agents continually scans the system environment health every 10 minutes, compressing hundreds of incoming alerts into a single, structured root cause report.
Rather than allowing software agents to make unverified changes to live code, this setup funnels the summarized data directly to a proactive team of L1–L3 human verification engineers who review, verify, and apply fixes 24/7. This approach breaks the single-person IT bottleneck without risking unvetted automation errors. As part of our comprehensive managed IT services, this hybrid model deploys dedicated operational sub-agents to protect specific areas of your system architecture:
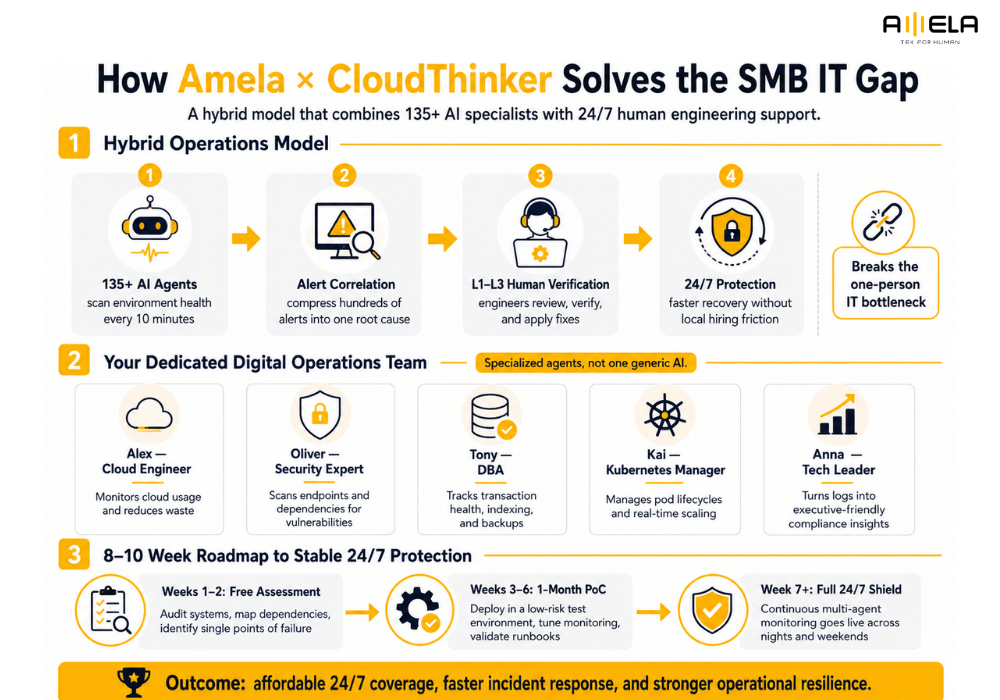
- Alex (Cloud Engineer): Keeps a continuous check on cloud infrastructure usage to eliminate resource waste.
- Oliver (Security Expert): Actively scans system endpoints and external software dependencies for vulnerabilities.
- Tony (DBA): Tracks database transaction health, performance indexing, and backup validity.
- Kai (Kubernetes Manager): Manages container pod lifecycles and handles real-time cluster scaling.
- Anna (Tech Leader): Translates complex technical system logs into clear, executive-friendly compliance insights.
How Can CTOs Implement AI Triage Without Damaging Production?
CTOs can safely implement automated triage by enforcing read-only data access scopes, restricting tools to specific APIs, and deploying through a phased multi-week sandbox verification roadmap.
Setting Up Read-Only Scopes and Typed Tool Boundaries
Restricting autonomous sub-agents to isolated data-gathering roles ensures they can flag anomalies without introducing destructive production changes.
The safest way to introduce intelligent triage into a production environment is to limit the automated platform’s permissions. During the initial implementation phase, your engineering team should grant the AI system strict read-only access to your cloud observability logging pipelines and metrics dashboards. By restricting the system to specific, typed data-gathering tools, it can securely read raw infrastructure telemetry and draft clear incident postmortems without having the database or network access required to execute code modifications. This protects your core architecture from unexpected automated changes while your team validates the accuracy of the system’s root cause analysis.
Persona Module: The CTO Decision Framework for Agentic Workflows
Engineering leaders must weigh data privacy requirements, cloud ingestion costs, and internal process maturity before giving automated tools direct workspace access.
Before integrating an automated triage system into your software delivery pipeline, a CTO must evaluate three critical factors:
- Data Compliance Boundaries: Ensure the automated tool processes all infrastructure metadata locally or within a secure virtual private cloud, preventing proprietary logs or customer information from leaking to public LLM models.
- Telemetry Ingestion Costs: Assess how the vendor structures their pricing; processing massive volumes of raw application logs can quickly lead to unexpected monthly cloud data bills if filtering isn’t optimized at the collection point.
- Process Maturity Integration: Verify that your current DevOps pipeline utilizes clear, structured logging standards, as automated incident tools require consistent telemetry data to map dependencies accurately.
How Can Companies Implement Stable 24/7 Incident Protection?
A structured, multi-week roadmap allows businesses to validate automated playbooks in low-risk test environments before a full rollout.
To safely transition your infrastructure to intelligent monitoring without interrupting daily operations, teams should follow a structured, phased deployment timeline:
- Weeks 1–2: Free Assessment – Audit existing system architectures, map deep infrastructure dependencies, and identify single points of failure across your cloud environment.
- Weeks 3–6: 1-Month Proof of Concept (PoC) – Deploy the monitoring tools inside an isolated, low-risk test environment, tune alert thresholds to remove background noise, and validate automated runbook logic against simulated system crashes.
- Week 7+: Full 24/7 Shield – Activate continuous multi-agent monitoring across your live production environment, backed by human-in-the-loop night and weekend engineering support to ensure complete operational resilience.
Implementing this structured AIOps for SMBs framework ensures your organization achieves faster incident response times and reliable, round-the-clock coverage without exposing your runtime environment to unverified operational risks.
Risks of Automated Incident Management
Automated incident management introduces clear risks, including automated errors from telemetry data gaps, unexpected runtime errors from unverified write actions, and a drop in team debugging skills if deployed without human gates.
Telemetry Data Gaps and Hallucinated Causes
Ensuring comprehensive data access across cloud providers, SaaS engines, and identity management software keeps the AI’s data pool contextually accurate.
When an engineering team restricts an automated triage system’s visibility to save on data transfer costs or limit access permissions, the system operates on a fragmented picture. If critical infrastructure or application logs are missing, the underlying models may mistake a downstream symptom for the core failure or generate an incorrect explanation for an outage. Establishing broad, properly configured read-only integration parameters across your entire technical environment prevents these analytical errors.
Unchecked Write Privileges Executing Broken Changes
Mandating strict human-in-the-loop approval gates for all high-consequence remediations prevents catastrophic environment changes.
Giving a multi-agent system the authority to independently alter your environment—such as executing server rollbacks or modifying database configurations—presents significant operational hazards. An unvetted automated script could trigger an unexpected loop of service restarts during a delicate state mismatch, easily turning a minor slowdown into an extended system outage. Enforcing strict manual validation gates before changes are written protects your active runtime stability.
Degradation of Internal Junior Engineering Skills
Repositioning junior engineers to serve as final human reviewers of automated postmortems and RCA reports maintains their architectural understanding.
Relying exclusively on automation to solve production incidents creates a major long-term training bottleneck for technical organizations. If junior developers only see finalized solutions without participating in the work of tracing logs and isolating performance variables, their manual debugging skills will stall over time. Structuring your workflows so that junior staff actively verify automated summaries ensures they continue to build strong system troubleshooting experience.
Frequently Asked Questions (FAQ)
This section addresses essential operational questions regarding engineering roles, expected recovery timelines, and diagnostic logic when using automated triage.
Can AI completely replace an on-call DevOps engineer?
Automated tools are designed to augment engineering teams by handling repetitive data correlation, not to eliminate the need for expert human oversight.
While automated platforms can isolate system anomalies and match incidents to known playbooks in seconds, they lack the high-level contextual understanding required to handle completely novel failure modes or complex architectural changes. Experienced engineers remain necessary to make final remediation choices and optimize the overarching software delivery pipeline.
What is the typical reduction in MTTR when using AI triage?
Organizations adopting automated root cause analysis often experience a drop in identification time from hours to mere minutes.
Traditional manual triage requires engineering teams to coordinate across multiple log platforms, which frequently drags out systemic outages. By instantly executing multi-source telemetry fusion and filtering noise, automated systems pinpoint the exact failure source immediately, often shaving up to 70% to 80% off the total time spent diagnosing an incident.
How does AI differentiate between an operational symptom and a true root cause?
By tracking dependency graphs and chronological event logs backward, the system isolates the initial failure point from downstream errors.
Instead of treating every system alert with equal priority, the platform builds an interactive dependency map of your cloud architecture. When multiple nodes report errors, the system analyzes the exact time-stamps and execution paths of each event, successfully tracking the cascade failure back to its original catalyst while ignoring normal operational spikes.
Conclusion
Adopting modern strategies for AI incident triage and root cause analysis allows growing businesses to move away from chaotic reactive troubleshooting and build a highly resilient development infrastructure. However, achieving maximum uptime requires more than just deploying a standalone software application into production. True stability comes from balancing advanced automated data analysis with trusted human validation. By combining multi-agent monitoring loops with professional, 24/7 human engineering oversight, technical leaders can eliminate alert fatigue, permanently reduce MTTR, and safely protect their delivery pipelines as their business scales.